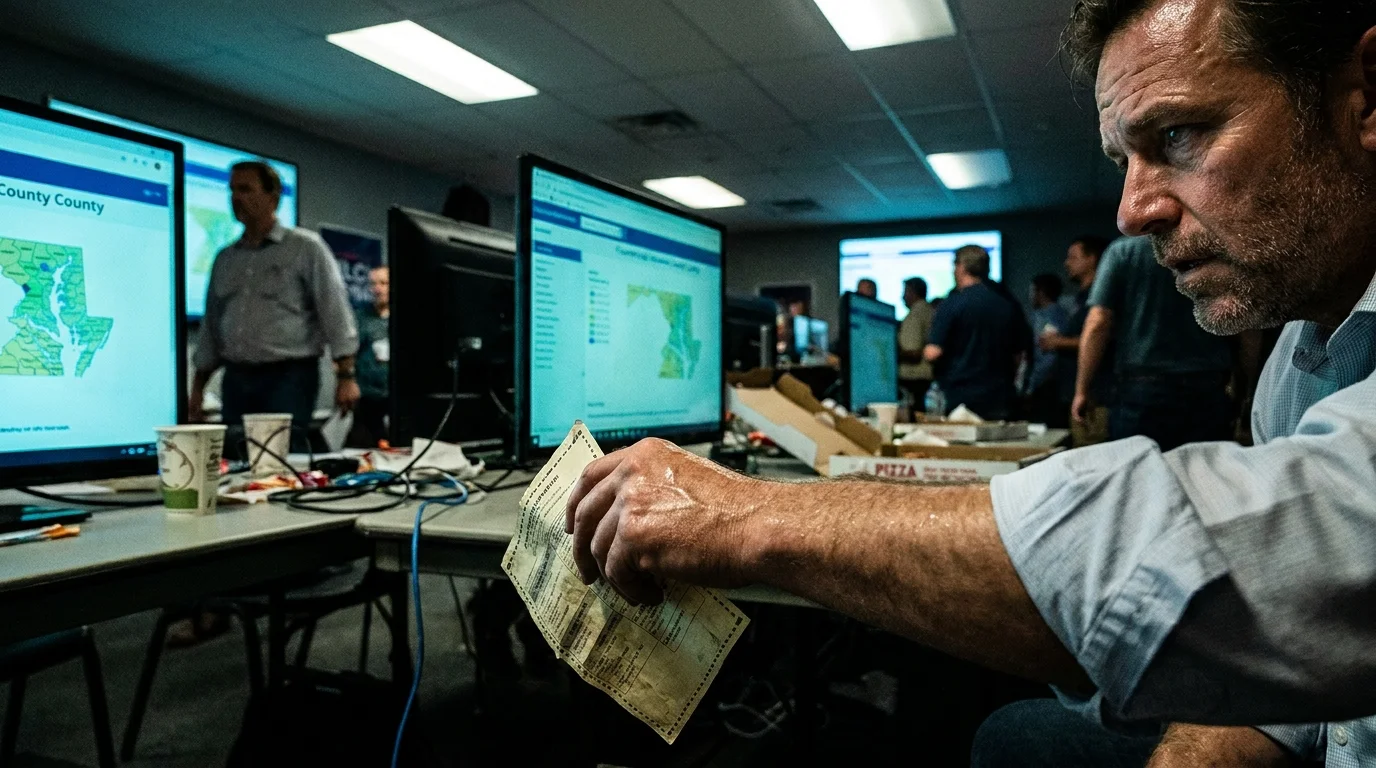
You sit by the morning kitchen window, coffee steaming against the glass, while a cable news anchor points to a pristine graphic. Across the screen, the newest Marist College battleground surveys paint an orderly picture: neat horizontal bars, reassuring decimals, and an electorate packaged into neat four-point margins. Everything looks clean, scientific, and resolved. Yet two states away in a county annex basement, a tired volunteer smooths their palm across a crinkled paper ballot, trying to flatten a corner caught in the intake scanner.
That tactile, stubborn sheet of heavy cardstock carries none of the polished symmetry found on television screens. It smells faintly of wood pulp, warehouse humidity, and rain carried in on heavy coats. In precinct backrooms, political operatives are pacing across scuffed linoleum, clutching clipboards, and staring at their private tracking dashboards with dry eyes. The public numbers tell them one story; the physical tallies waiting in ballot bags tell an entirely different one.
For months, you have been invited to consume these published survey releases as prophetic declarations. When high-profile polling institutions announce swing-state margins, financial donations pivot, television ad reservations vanish overnight, and campaign strategies lurch violently in response. But when you strip away the institutional sheen, you begin to see where the machine binds up against real lives.
The Acoustic Shadow of the Modern Sample Line
To understand why campaign strategists break into a cold sweat behind closed doors, you have to picture an acoustic shadow. In maritime history, captains sometimes watched artillery flash along a nearby coastline without hearing a single crack of thunder—the sound waves were bent upward by cold layers of air, passing harmlessly above their masts. Published battleground surveys increasingly suffer from the exact same atmospheric bend.
When an institutional polling unit dials into a target legislative district between ten in the morning and four in the afternoon, they sample an artificial world of people who have the luxury of answering an unknown number. If you punch an eight-hour clock on an assembly line, monitor a patient monitor in an intensive care unit, or deliver parcels along slush-filled side streets, your phone stays in a locker or buzzing unnoticed against your hip. You do not stop to participate in a twelve-minute institutional battery on economic optimism.
- FHFA mortgage loan fees switch suburban closing costs onto crisp cashier checks
- Kennedy Center federal funding disputes trigger fierce midnight Capitol Hill spending roll calls
- United States midterm election precincts reveal rapid suburban voter flips across scratched voting screens
- Military operation authorization votes expose sharp candidate rifts under glaring studio spotlight heat
- Dixville Notch midnight ballots spark rapid campaign panic across hand-carved cedar voting booths
The survey houses attempt to compensate for this silence through aggressive statistical weighting. They adjust demographic dials, amplify single respondents to represent dozens of peers, and project clean lines over vast silences. Yet no mathematical formula can weigh a voice that refused to pick up in the first place, leaving nervous war rooms stranded between mathematical theory and raw precinct reality.
Consider Marcus Vance, a 44-year-old regional field director running legislative races across northeastern Pennsylvania. Last autumn, Vance watched three consecutive public polls place his candidate down by six points, triggering panicky conference calls from national party donors demanding he pull resources from blue-collar river towns. Instead of retreating, Vance reviewed his field logs: volunteer canvassers were logging record-high door conversations with night-shift logistics workers who had ignored every single unsolicited telephone call for six straight months. When the county cleared the ballot drop boxes on election night, the district swung toward Vance’s candidate by two full points—a terrifying eight-point variance that media outlets quietly buried beneath the next morning’s horse race coverage.
Decoding the Three Hidden Fault Lines in District Sampling
When you look past the topline banners of battleground survey updates, you find that voters do not move in uniform national tides. The gap between published surveys and true precinct momentum breaks down along three distinct behavioral divides:
- The Second-Shift Ghost Cohort: Dual-income hourly households that work non-traditional hours are virtually absent from standard daytime callback models. Because their daily routines do not match corporate schedules, their shifting economic priorities remain invisible until their physical ballots pass through optical scanners.
- The Screened-Call Suburban Veto: High-propensity suburban voters increasingly use automated smartphone filters that quietly route non-contact calls directly into digital voids. What looks like voter apathy or low turnout on a call sheet is actually just modern personal privacy defense, leaving pollsters guessing about last-minute persuasion shifts.
- The Reluctant First-Timer: Registered citizens who feel alienated by partisan posturing rarely spend fifteen minutes answering multi-part Likert scale questions. They will, however, stand in line for forty minutes on a Tuesday evening when an immediate local grievance—like county property revaluations or school closures—strikes close to home.
How to Audit Political Data with Clear Eyes
You do not need an advanced degree in political science to evaluate survey claims without getting swallowed by anxiety. By shifting your attention away from breathless cable graphics and zeroing in on fundamental structural markers, you can read the electoral landscape with the cool precision of a veteran precinct worker.
The secret lies in observing how a poll gathers its raw materials rather than obsessing over its final prediction. When a new media release drops, skip the candidate names and search the methodology footnote at the very bottom of the report.
- Check the field collection window immediately; surveys conducted across only forty-eight hours invariably miss shift workers who take consecutive weekend rotations.
- Look at the contact mode mix to see if the researchers relied solely on automated text links, which regularly skew toward screen-attached urban demographics.
- Examine the unweighted sample size of voters without a four-year college degree to ensure the research team did not mathematically stretch a tiny handful of respondents to represent entire industrial ZIP codes.
- Compare the published numbers against active ground operations, observing whether local campaigns are opening physical offices in areas the survey claims are already lost causes.
The Battleground Reader’s Tactical Toolkit
- Usable Field Window: Minimum five days of live caller contact across varying dayparts.
- Response Threshold Reality: A single-digit response rate (often below 2%) requires massive modeling assumptions.
- Target Geography: Precinct-level sample density rather than statewide media market blends.
The Quiet Certainty of the Polling Booth
There is a peculiar serenity that arrives when you stop treating political forecasting as gospel and begin viewing it as an imperfect institutional snapshot. The noise generated by hourly news cycles wants you to believe that every election is decided weeks before you ever walk into a gym, library, or community church to cast your ballot.
Yet democracy retains an irreducible physical truth that no algorithm can fully preempt. It lives in the weight of a graphite pencil, the mechanical thunk of a voting booth curtain, and that crinkled paper ballot sliding into a metal ballot box. When you recognize that institutional surveys are simply educated guesses made through a clouded window, the panic recedes. The actual future does not belong to the phone bank dials; it belongs to the citizens who quietly show up when the doors unlock at sunrise.
Real voter momentum is never captured through an unsolicited phone call during the dinner rush; it is forged at kitchen tables and confirmed on heavy paper.
| Measurement Factor | Institutional Survey Assumption | Ground-Level Precinct Reality |
|---|---|---|
| Voter Availability | Assumes registered adults answer unsaved phone numbers during weekday evening hours. | Working-class families screen unfamiliar calls to protect scarce resting hours between shifts. |
| Demographic Weighting | Uses past census tables to mathematically multiply rare respondents into representative blocs. | Artificially weighted responses amplify individual eccentricities instead of true community consensus. |
| Ballot Completion | Treats every stated preference as equally likely to translate into physical turnout. | Only voters with deeply felt local stakes reliably navigate logistical hurdles to drop a ballot. |
Frequently Asked Questions
Why do respected institutional surveys like Marist sometimes differ so sharply from private campaign data?
Public institutions run occasional statewide snapshots using standardized scripts, whereas campaigns maintain persistent, localized voter databases built from direct door canvassing, volunteer conversations, and real-time voter file updates.How does telephone call screening specifically distort battleground polling?
Smartphones automatically flag or silence calls from unknown numbers, skewing live caller response pools toward retired, homebound, or white-collar demographics while virtually excluding hourly workers who cannot carry phones on duty.What is baseline sampling distortion?
It occurs when the initial pool of people who agree to take a survey shares unusual personality traits—such as high free time or extreme political engagement—that do not reflect the broader, more exhausted voting public.Does a crinkled paper ballot create processing errors in voting machines?
Modern optical tabulators are designed with high-tolerance rollers to read creased or textured paper, but precinct workers must occasionally flatten ballots by hand to ensure barcodes align with the optical sensors.What is the most reliable way for me to track a race without obsessing over daily headlines?
Pay closer attention to local municipal races, regional early-vote turnout patterns, and voter registration changes in suburban and exurban counties rather than volatile horse-race survey margins.