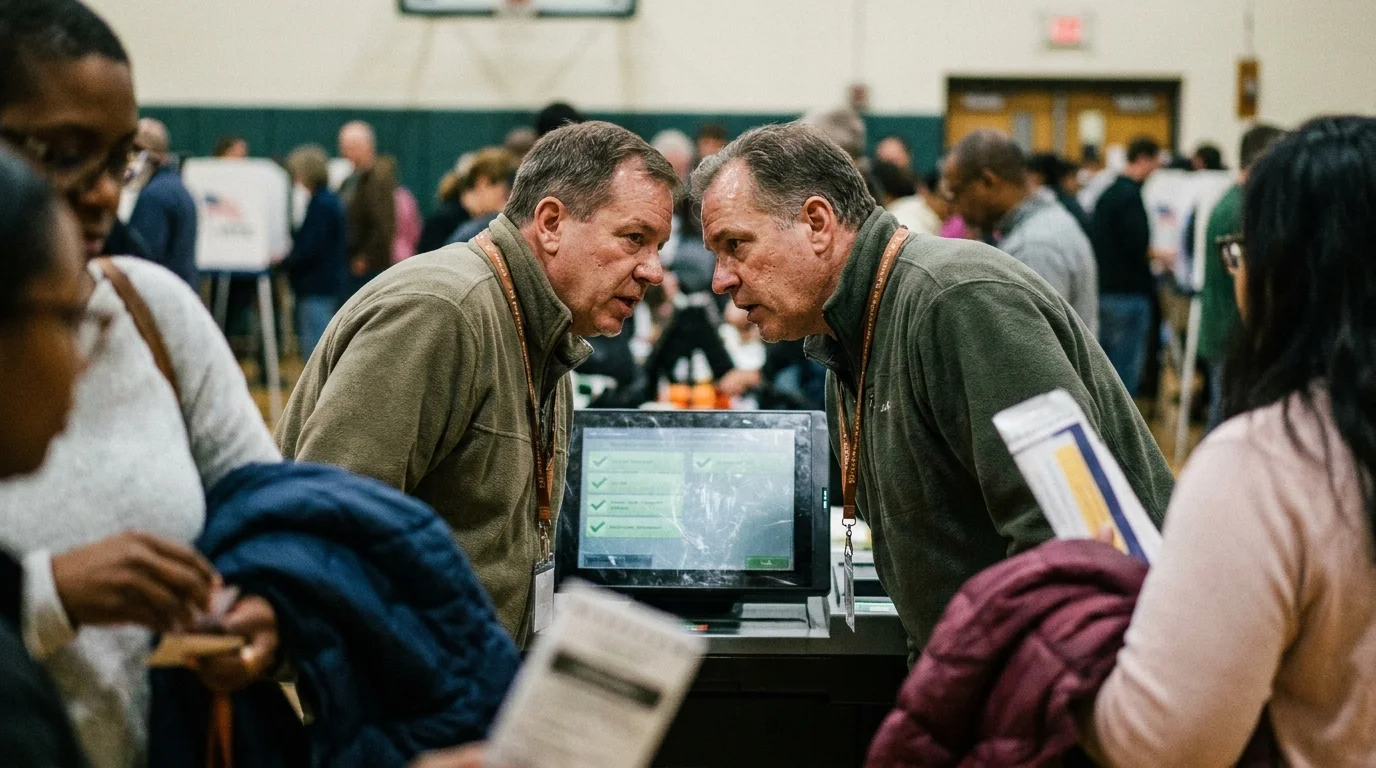
The high school gymnasium smells faintly of industrial floor wax and rain-soaked wool coats. Under fluorescent bulbs that hum with a low, nervous frequency, you slide your finger across the plastic interface of a county machine. Scratched voting screens displaying glowing district checkmarks respond with a faint pulse of light, recording a decision that statisticians thousands of miles away insisted you would never make.
You are standing inside precinct boundaries that look familiar on paper, but feel entirely alienated from the Sunday talk shows. The national narrative tells you that voters march in rigid, predictable blocks, sorted neatly by party registration and broad demographic bands. Yet here on the ground, the mechanical click of the ballot printer tells an entirely different story, one built on quiet, localized ruptures rather than sweeping partisan waves.
When the polling booth curtain sways open, you see your neighbors: people who mow their lawns on Saturday mornings, shuttle kids to soccer tournaments in minivan lines, and carry a deep, unvoiced skepticism about the maps drawn for them in state capitols. The ground underneath national polling has quietly fractured, turning ordinary subdivisions into volatile political fault lines.
The Illusion of the Monolithic Generic Ballot
For months, broadcast studios have peddled the concept of the national mood as if it were a single weather front moving smoothly across the country. They treat the generic ballot like an ocean tide that lifts or sinks every district uniformly. In reality, redistricting has turned our electoral map into an archipelago of distinct micro-climates, where a five-block stretch of cul-de-sacs can harbor entirely different economic anxieties than an apartment complex two exits down the interstate.
Think of suburban voting patterns not as concrete pathways, but as thin topsoil on a steep hill. A single localized economic tremor—a school redistricting vote, a sudden municipal water tariff, or an unfunded transit corridor—can wash away generational party loyalty in a single afternoon. Precinct tally sheets expose that voters are no longer adopting party platforms wholesale; they are ruthlessly auditing local outcomes directly at the ballot console.
- Military operation authorization votes expose sharp candidate rifts under glaring studio spotlight heat
- Dixville Notch midnight ballots spark rapid campaign panic across hand-carved cedar voting booths
- ActBlue smart tip popups trap small donors behind tiny glowing blue sliders
- Office of Legal Counsel memos block expansive presidential directives behind red wax stamps
- Senate Legislative Counsel redlines derail midnight compromise packages with hurried pencil strikes
Elena Vance, a 51-year-old county election judge in Chester County, Pennsylvania, has watched this behavioral mutation from behind the voter sign-in table for fifteen years. During a recent special election trial run in precinct 42-B, she noted that voters who had unfailingly backed one party on straight-ticket ballots for two decades were lingering over local legislative seats for nearly three minutes, their fingers hovering before intentionally splitting their tickets across newly shaped assembly lines.
Mapping the Ruptures: Zip Codes That Defied the Models
When you peer into the raw precinct data rather than the smoothed-out cable news bar graphs, specific ZIP codes reveal how localized friction invalidates aggregate polling models. These newly drawn boundaries have gathered strange bedfellows together, forcing long-time suburban conservatives and newly relocated urban professionals to negotiate the same school boards and state legislative seats.
Consider the suburban shifts across these critical jurisdictions during recent election cycles:
- ZIP 19341 (Exton, PA): Once considered an immovable bastion of moderate conservatism, redistricting merged historic residential corridors with high-density corporate campuses, sparking an eight-point margin reversal driven almost entirely by unaffiliated split-ticket voters.
- ZIP 30024 (Suwanee, GA): Rapid demographic transformation collided with redrawn state house lines, turning an uncontested outer-ring district into a razor-thin testing ground where precinct turnout surged by twenty-two percent over baseline off-year expectations.
- ZIP 85255 (North Scottsdale, AZ): Where water-usage restrictions and hyper-local land use controversies severed traditional suburban party loyalty, yielding unprecedented split ballots between federal and legislative offices.
- ZIP 53092 (Mequon, WI): A historically reliable outer-ring suburban enclave where municipal school board battles scrambled party lines, triggering a six-point turnout pivot away from historical baselines.
Decoding the Signal: An Independent Audit of Your Precinct
You do not have to rely on beltway consultants to understand where your own neighborhood stands on election night. By learning to read local canvas reports like a seasoned field director, you can spot the structural shifts hours before the anchors call a race.
Take a measured, deliberate approach when reviewing returns as the polling stations report their numbers.
- Pull up your county board of elections raw results dashboard rather than cable networks, focusing specifically on your immediate precinct number.
- Compare the total votes cast in the top-of-the-ticket contest against down-ballot state legislative races to identify undervote trends and ballot-splitting behavior.
- Track early in-person vote totals separately from day-of-election tabulations to gauge which ideological factions showed actual physical urgency.
- Examine precinct turnout percentages relative to registered active voter rolls rather than raw vote counts to reveal grassroots energy pockets.
Keep your analytical toolkit grounded in observable county mechanics. Focus purely on certified margins, historical participation baselines, and certified geographic maps rather than exit polling speculation or social media reaction threads.
The Bigger Picture: Reclaiming Local Civic Clarity
Looking past the noise of the nationalized political circus offers an immense sense of relief. When you realize that major national elections are truly decided in high school gyms, firehouses, and library basements by everyday citizens balancing their household ledgers, the manufactured panic of the news cycle begins to recede. Your community is not an algorithm, and your vote is not a foregone conclusion calculated by an analyst in a studio.
Understanding the actual mechanical reality of your precinct restores your agency as a voter. You begin to see your neighbors not as enemies in an endless national culture war, but as fellow participants weighing complex local trade-offs on the same scratched screens. In a media landscape dominated by manufactured consensus, the quiet unpredictability of the American voter remains our most potent democratic defense.
The true pulse of a republic is never measured in a television studio; it is etched quietly onto municipal ledger sheets inside quiet suburban precinct halls.
| Key Point | Detail | Added Value for the Reader |
|---|---|---|
| Generic Ballot Divergence | National polling aggregates systematically overlook micro-geographic redistricting friction. | Allows you to filter out cable news panic and focus on real local dynamics. |
| Suburban Split-Ticketing | Voters are increasingly decoupling top-of-ticket federal candidates from local assembly choices. | Explains why legislative control frequently defies executive branch race outcomes. |
| Precinct-Level Canvas Data | County election sites publish machine-level tabulations on election night before networks project. | Empowers you to track actual precinct results before media narratives solidify. |
Frequently Asked Questions
Why do national polls fail to capture suburban precinct flips?
National surveys rely on broad statewide or nationwide demographic quotas that smooth out hyper-local geographic realities. When state legislatures redraw boundary lines, they shuffle unique neighborhoods together, creating local policy conflicts that generic federal polls simply cannot detect.What is driving the rise in split-ticket voting in these suburbs?
Suburban voters are increasingly separating their ideological views on national figures from practical local priorities like property assessments, public school funding, and regional zoning laws, prompting them to divide their support across party lines on the same ballot.How can I find the redrawn map for my specific precinct?
Your official county clerk or board of elections website maintains interactive GIS boundary maps. Simply enter your residential address to view your designated precinct number alongside your updated state house, state senate, and congressional boundaries.Does high turnout in a suburban district consistently favor one party?
No. High suburban turnout frequently signals intense local discontent that cuts across both major parties, often producing erratic electoral outcomes where long-term establishment candidates from either party face unexpected defeats.Where can I access unfiltered precinct returns on election night?
Skip national aggregators and navigate directly to your local county election administration page. Most counties stream live machine tallies precinct-by-precinct as memory cartridges arrive from polling stations.