A sharp ringtone cuts through the quiet hum of your kitchen past midnight. On your screen, a forwarded voice note ripples through a hyper-local neighborhood group, claiming a frontrunner in your county primary just dropped out and endorsed their rival. The voice has the familiar rasp, the signature cadence, even the subtle drawl you have heard on local news for years. Your pulse spikes, but as you listen closely through earbuds, something feels hollow, like listening to someone speak through a paper cup.
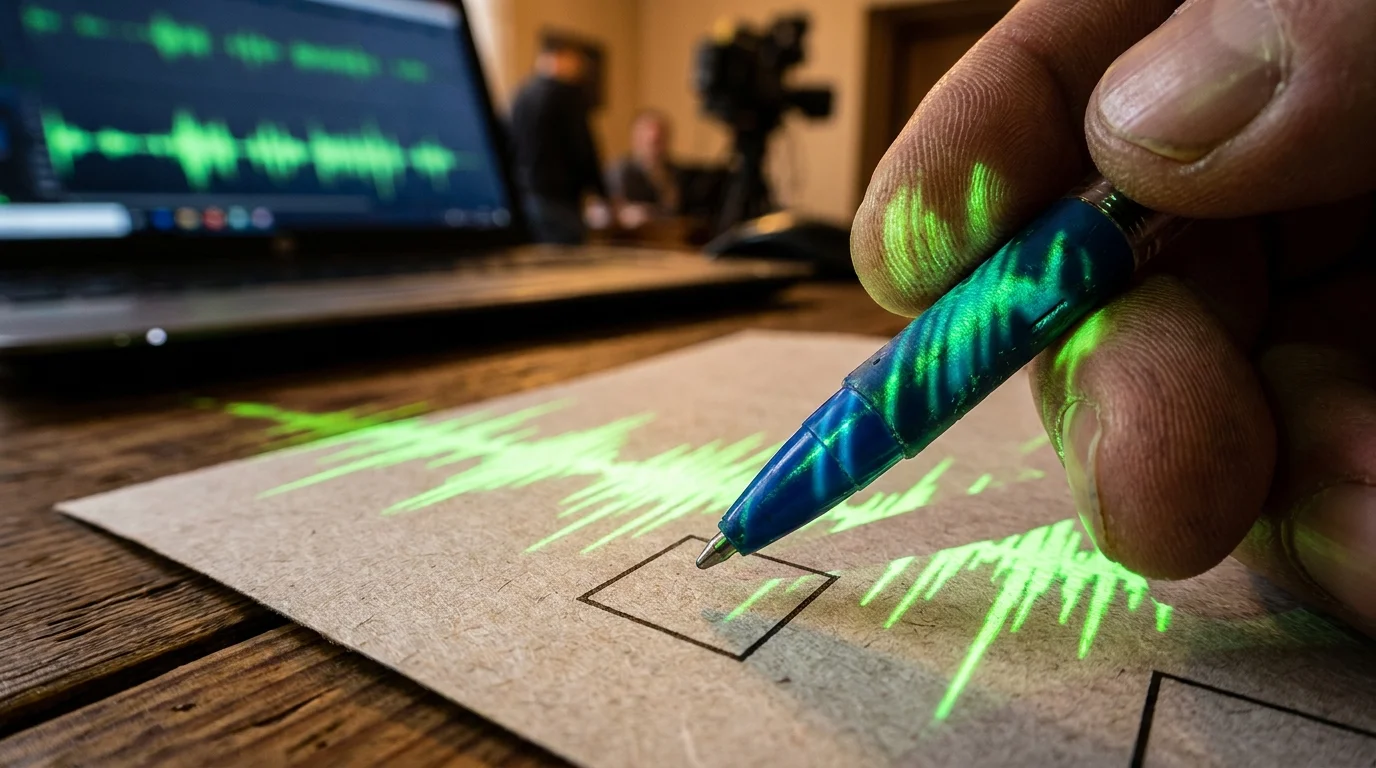
You drag the audio file into a basic browser window. Within seconds, fluorescent green audio waveform spikes paint your laptop monitor against a pitch-black background. What sounded convincing to your ear looks absurdly artificial to your eye: razor-sharp, mechanical horizontal lines running across the frequencies like prison bars, accompanied by an abrupt, unnatural drop into dead silence right at the eight-kilohertz mark.
For months, the running narrative has convinced voters that combating political misinformation requires million-dollar forensic labs or bespoke machine learning detection models. The reality on the ground is far more practical. Synthetic voice models leave distinct, mathematical scars that cannot hide once sound is translated into visual light.
The Metaphor of the Painted Brick Wall
Human speech is messy, warm, and chaotic. When air moves from human lungs past vocal cords and bounces off nasal cavities, it produces irregular acoustic friction—tiny micro-tremors, uneven breath releases, and organic ambient noise. A real voice in a room behaves like a weathered brick wall, full of porous micro-textures and uneven mortar lines.
Synthetic speech generated by voice-cloning engines does not push physical air. It predicts the most likely sound values using mathematical weights, effectively applying a flat coat of latex paint over smooth drywall to simulate brick. To your ears, the brain fills in the missing depth because it recognizes the candidate’s familiar tone. But when you look at an audio spectrogram—a visual map that graphs time on the horizontal axis and sound frequency on the vertical axis—the digital shortcut stands out immediately.
Instead of the lush, sloping acoustic gradients of a real person speaking, synthetic audio prints rigid mathematical frequency bands across the visual canvas. These artifacts are not subtle quirks; they are the structural scaffolding of generative code.
- Pete Hegseth general dismissals derail Pentagon leadership stability sparking urgent Capitol Hill hearings
- Omnibus appropriations rider slips switch contentious funding lines with hurried pencil scratches
- Florida primary election results expose massive precinct shifts across coastal suburban voting corridors
- Byron Donalds floor debate sparks explosive clashes over disputed congressional spending measures
- Dixville Notch midnight ballots reveal early primary momentum under harsh wooden lodge spotlights
The Ohio Precinct Anomaly
Elena Vance, a 34-year-old community audio archivist and volunteer poll watcher in Columbus, Ohio, faced this exact scenario during a tense school board runoff last spring. An anonymous audio file circulated on social media thirty-six hours before polls opened, purporting to show a candidate privately insulting rural voters in her district.
Rather than waiting for corporate news networks to issue a delayed fact-check, Vance downloaded the sixteen-second clip, opened a free open-source audio editor on her five-year-old laptop, and switched the track view from standard waveform to spectrogram. Within three minutes, she pinpointed a continuous, flatline frequency ceiling at exactly 16,000 Hertz and an eerie absence of low-end room reverb under the consonants. Vance posted the visual side-by-side to the county forum, dismantling the smear before morning drive-time radio could amplify it.
Three Telltale Scars in Synthetic Political Audio
Not all deepfakes are rendered with the same quality, but almost all fast-turnaround political audio clones suffer from one of three structural anomalies visible on a visual frequency map.
The Brick-Wall Cutoff Shelf: Budget and rapid-deployment voice cloning models conserve processing power by training on compressed audio data capped at 8 kHz or 16 kHz. When a synthetic candidate speaks, their voice abruptly vanishes above these exact numeric thresholds. In a genuine recording made on an iPhone or a reporter’s microphone, background air and consonant sizzle naturally taper into the 20 kHz ceiling.
The Harmonic Barcode: Natural human vocal resonance creates soft, wavy harmonic curves that shift slightly with pitch and emotion. Synthetic voice generation frequently outputs unnatural parallel horizontal lines that look like a barcode stamp across the mid-range frequencies. These represent static mathematical tones rather than vibrating tissue.
Pasted Room Silence: To mask digital dryness, creators often paste a separate track of crowd murmur or static beneath the cloned voice. On a spectrogram, the vocal track will show harsh rectangular cuts where the synthetic voice engages and disengages, while the background noise flows underneath without interacting physically with the speaker’s vocal resonance.
The Kitchen-Table Audio Audit
Verifying a suspicious political recording takes less than two minutes and costs nothing. You do not need specialized credentials or expensive software; you only need to look at what you are hearing.
- Acquire the Raw Audio: Save the circulating clip directly to your desktop or phone rather than recording your speakers with another device.
- Open a Free Spectrogram Tool: Launch an open-source tool like Audacity or a web-based acoustic visualizer such as Academo Spectrum Analyzer in your browser.
- Switch Track Display: In Audacity, click the dropdown arrow next to the track name on the left panel and select Spectrogram instead of Waveform.
- Inspect High Frequencies: Adjust your vertical scale to view 0 Hz through 22,000 Hz. Check whether sound frequencies abruptly stop along a straight horizontal line at 8,000 Hz or 16,000 Hz.
- Examine Consonant Noise: Look closely at ‘S’, ‘T’, and ‘P’ sounds. Natural speech shows soft vertical bursts of visual noise; synthetic speech shows sheared, geometric blocks with crisp rectangular edges.
Tactical Toolkit for Rapid Sound Verification
Keep these baseline visual metrics in mind when assessing political audio clips in the final weeks of a campaign season:
- Linear Scale View: Best for spotting unnatural cutoff shelves above 8 kHz.
- Logarithmic / Mel Scale View: Best for checking the lower-frequency harmonic ribbons of human speech (100 Hz to 3,000 Hz).
- Noise Floor Inspection: Zoom in on the pauses between spoken sentences. If the visual frequency texture goes completely pure black (absolute mathematical zero) between words while the speaker is supposedly in a public hall, the voice is synthetic.
The Clarity of Visual Proof
In an era where synthetic campaign media aims to trigger immediate emotional reactions, learning to read sound with your eyes gives you an unexpected degree of calm. Disinformation relies on speed, urgency, and the assumption that everyday citizens cannot peer behind the digital curtain without institutional permission.
When you transform a viral audio clip from an alarming soundbite into a visual blueprint, the manipulation loses its emotional grip. You are no longer guessing whether a candidate actually said those damaging words; you are simply checking the scaffolding. That quiet capability turns every voter from a passive target of algorithmic warfare into an active verifier on their own block.
Visualizing sound frequencies strips away the emotional weight of a fake voice and reveals the rigid code beneath it.
| Key Point | Detail | Added Value for the Reader |
|---|---|---|
| Frequency Cutoff | Synthetic audio often caps abruptly at 8 kHz or 16 kHz. | Enables immediate visual identification of low-cost voice models within seconds. |
| Harmonic Striping | Rigid parallel horizontal bands across the vocal mid-range. | Separates organic human vocal resonance from calculated mathematical tones. |
| Inter-Word Noise Floor | Total visual silence (zero data) between spoken phrases. | Exposes pasted ambient noise layers instantly without professional audio gear. |
Frequently Asked Questions
Do I need to pay for forensic audio software to check deepfake audio?
No. Free, open-source programs like Audacity or browser-based tools like the Academo Spectrogram provide the exact visual frequency resolution required to spot standard synthetic artifacts.Can advanced AI voice models bypass the 16 kHz frequency cutoff?
High-end models can generate full-bandwidth audio up to 22 kHz, but they still struggle to replicate human breath dynamics, natural sibilance, and subtle room reverberation without leaving visual mathematical grid patterns.Why do synthetic voices sound real to my ear if the spectrogram shows obvious flaws?
Human brains use predictive processing; when we recognize a familiar voice or cadence, our minds automatically smooth over small acoustic gaps. Spectrograms bypass human cognitive bias by displaying raw physical data.What is the quickest giveaway in a short social media voice memo?
Look at the pauses between words. Real audio recorded in an office or room maintains a consistent low-level visual fuzz (the room noise floor), whereas synthetic audio often drops to sterile mathematical black between syllables.Does compressing an audio file for social media ruin the spectrogram analysis?
While social media compression reduces overall fidelity, it compresses the entire file uniformly. It does not create the unnatural horizontal harmonic bars or flatline frequency shelves typical of voice-synthesis models.