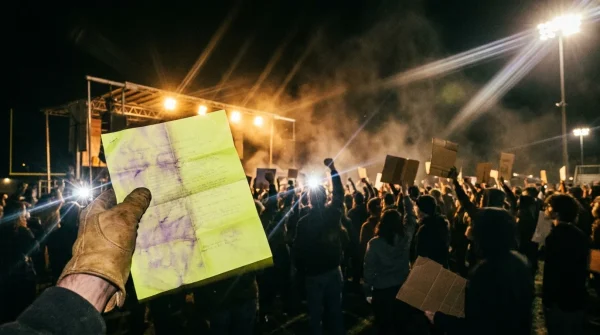
The fluorescent fixtures in the county annex hum at a low sixty hertz, casting an unyielding sheen across forty-year-old linoleum. You sit on a molded plastic chair with a lukewarm paper cup of coffee, looking down at an updated precinct boundary schematic that bears almost no resemblance to the community you walked through this morning. Outside the double doors, the cross-town bus rattles down 14th Avenue, belching diesel exhaust past front porches where neighbors have shared tools, watched each other’s children, and organized school fundraisers for generations.
Inside the digital mapping suite running on the county planner’s monitor, your neighborhood no longer exists as a living organism of brick bungalows, community gardens, and church parking lots. It appears as census tracts, reduced to cold coordinate nodes and demographic density heatmaps. The cursor clicks twice, and an invisible digital incision travels directly down your street, separating front doors from across-the-way porches and assigning lifelong neighbors to completely separate municipal districts.
You grow up believing electoral cartography mirrors physical reality—riverbeds, freight rail corridors, or historic neighborhood boundaries recognized by everyone who buys groceries on the corner. Yet modern precinct redistricting functions more like an automated scalpel, slicing through civic fabric under the sterile defense of statistical population balancing.
The Algorithmic Sieve: How Mathematical Neutrality Erases Physical Coalitions
Consider what happens when you slice a mature root system into four separate containers. The soil in each pot might weigh precisely the same down to the single ounce, satisfying every regulatory requirement for mathematical balance, yet the plant itself collapses because its shared vascular network has been severed.
This is algorithmic boundary partitioning. For decades, gerrymandering was an overt, clumsy exercise conducted with grease pencils behind closed doors to shield legislative incumbents. Today, hyper-specialized redistricting software—using automated spatial algorithms—carves historic urban voting neighborhoods into fragmented quadrants that dismantle local school board coalitions without ever leaving an explicit fingerprint of racial or partisan bias on the public record.
The software optimizes for fragmentation, scattering cohesive civic voting blocs into adjacent suburban districts where their localized concerns are statistically diluted. When your neighborhood is carved into four distinct wards, your petition for middle school safety renovations no longer reaches the dais as a unified voice from five hundred parents. It arrives as four negligible requests split across four different board members, each outvoted by outer-ring precincts with completely different spending priorities.
- Historic preservation panels override local city councils to enforce sudden neighborhood building bans
- Paid family leave payroll hikes slash middle class worker paychecks across Western states
- Permian Basin crude pipeline limits squeeze regional refineries fueling sudden Midwest pump spikes
- National Archives records reveal secret Cold War intelligence directives overriding congressional oversight
- Fox News broadcast segments split partisan viewers over high-stakes diplomatic talks with Iran
Marcus Vance, 52, a municipal surveyor and lifelong resident of the East Oak district, spent twenty-four years tracing county property records before noticing this shift in his own neighborhood. During a routine review of proposed school board wards, he recognized that automated redistricting software had quietly segmented his civic association across three separate trustee jurisdictions along an arbitrary storm-drain utility easement. “The software does not know where the neighborhood children walk to soccer practice; it is calibrated to break up high-turnout quorums before public comment even opens,” Marcus testified during a board review, presenting municipal GIS files that proved the new borders rendered a fifteen-year advocacy campaign for local classroom literacy funds numerically irrelevant.
The Anatomy of the Split: Three Ways Software Weakens Your Ballot
Recognizing the distinct ways boundary mapping software carves up local terrain helps you spot dilution strategies long before candidates launch campaigns for open trustee seats.
The Heritage Block Splinter
Generational neighborhoods anchored by longstanding community organizations are prime targets for algorithmic splitting. Specialized mapping software identifies these cohesive voting blocs and splits them along residential streets, placing facing homes into competing school trustee zones.
Your organized parent voting bloc gets sliced in half down the yellow center line of the street, forcing longtime neighborhood leaders to campaign in two separate jurisdictional pools simultaneously.
The Multi-Family Buffer
Apartment complexes, garden flats, and affordable housing clusters are often partitioned down private internal driveways. The software takes advantage of pedestrian pathways to set district borders, walling off renters from the single-family residences they share elementary bus stops with every morning.
This creates an artificial political wall that prevents parent-teacher organizations from building joint voter turnouts between tenants and property owners who share an urgent interest in local classroom staffing ratios.
The Transit Corridor Severance
Commercial avenues that serve as neighborhood gathering points are frequently converted into hard boundaries. Rather than serving as the heart of local civic life, the local shopping corridor becomes an administrative wall that isolates neighborhood schools from the small business owners who hire their graduates and sponsor their athletic leagues.
Local economic support systems dissolve when local school policies are handled by trustees who answer primarily to communities located miles away from that central commercial corridor.
Auditing the Lines: A Practical Toolkit for Precinct Defense
Protecting your school board representation requires stepping past partisan talking points to audit the raw geographic data that county administrators quietly approve between federal election cycles.
- Download Raw GIS Shapefiles: Request native shapefile packages or GeoJSON files directly from your county registrar rather than relying on decorative PDF maps that obscure street-level parcel breaks.
- Examine Feeder Pattern Incongruities: Cross-reference precinct maps against local elementary-to-high-school feeder boundaries to identify instances where a single attendance boundary is split among three or more trustee districts.
- Monitor Micro-Annexation Adjustments: Review municipal boundary commission dockets for minor precinct realignments tucked into consent calendars; these quiet administrative adjustments often bypass public hearings entirely.
- Deploy Compactness Testing: Measure contested districts with open-source tools using Reock or Polsby-Popper tests to demonstrate to administrative judges that the proposed districts breach statutory requirements for spatial compactness.
The Quiet Power of Local Cartography
There is profound clarity in realizing that your community’s struggles to secure basic classroom resources are rarely caused by parent apathy or poor turnout. When neighborhood petitions disappear, when infrastructure bonds bypass your local playground, or when the school board dismisses your testimony, it is easy to assume your community has simply lost its collective drive.
The maps were deliberately redrawn to generate that specific sense of isolation. When you learn to decipher the algorithmic boundaries running down your street, you trade vague frustration for practical civic literacy. Recognizing the artificial lines designed to divide your neighborhood gives you the tools to rebuild your coalitions across ward borders, ensuring your community’s shared future is never drafted away by automated mapping software.
True local democracy depends on borders drawn around real human relationships, not algorithmic formulas engineered to dissolve community consensus.
| Key Point | Detail | Added Value for the Reader |
|---|---|---|
| Algorithmic Partitioning | Automated GIS software splits high-density voter networks across multiple school board districts. | Reveals why high community turnout still fails to elect aligned local board members. |
| Feeder Misalignment | Precinct boundary lines diverge from actual public school attendance and transportation zones. | Provides hard, cartographic evidence for formal administrative boundary appeals. |
| Spatial Compactness Rules | State statutes typically require contiguous, compact local boundaries without artificial peninsulas. | Supplies a direct legal framework to overturn fragmented district maps in court. |
How does algorithmic redistricting differ from traditional legislative gerrymandering?
While state legislative gerrymandering primarily protects partisan majorities across large congressional zones, precinct-level partitioning quietly splits small, local communities of interest down to neighborhood streets, neutralizing neighborhood coalitions in non-partisan municipal and school board elections.Can software redistricting alter who runs for my local school board?
Yes. By moving boundary lines even two blocks over, mapping commissions can draw active parent leaders or reform-minded candidates directly out of their target trustee districts, disqualifying them from the ballot before filing deadlines close.What is the most effective metric to prove our neighborhood was improperly fragmented?
Mathematical compactness scores—such as the Polsby-Popper or Reock tests—offer the strongest proof by demonstrating that an awkward district boundary was drawn unnaturally to carve up specific residential coalitions.How do I find out when my municipal school board voting boundaries are being redrawn?
Check the public notices page of your county board of elections or municipal charter commission for redistricting advisory committee agendas, which are typically scheduled shortly after decennial census releases or county population redistributions.What can our neighborhood association do if our precinct lines have already been finalized?
You can file an administrative petition challenging the map’s compliance with state compactness requirements, or organize cross-ward coalitions that coordinate voter guides across the newly separated districts to maintain unified voting power.