The gravel crunching under worn work boots at 5:15 in the afternoon tells a very different story than the evening cable news ticker. You smell diesel exhaust, wet macadam, and stale breakroom coffee cooling in paper cups as hundreds of assembly workers clock out into the brisk Pennsylvania twilight. Inside their jacket pockets, personal smartphones buzz silently against their ribs, screening calls from unknown out-of-state area codes before routing them directly to ignored voicemails.
Across national news desks, analysts spend millions analyzing decimal points on multi-color line charts, convinced they possess a clean cross-section of the American electorate. Yet the statistical apparatus gathering those numbers rests on a hollow foundation, breathing through a pillow of automated screeners and algorithmic guesswork that rarely touches the actual production floor.
When you watch a battleground poll flash across your screen with its crisp plus-or-minus margin, you are rarely seeing who will vote. You are looking at an artifact of who had the leisure time, the quiet living room, and the particular temperament to talk to a stranger for twenty-two consecutive minutes.
The Ghost In The Call Log
Consider public opinion sampling not as a precision mirror, but as an acoustic distortion chamber. For decades, traditional survey science relied on random digit dialing under the clean assumption that if you ring enough bells across a ZIP code, the distribution of respondents naturally mirrors the town itself. But in our modern digital ecosystem, response rates have cratered below two percent, leaving statistical firms scrambling to patch the gaps using aggressive mathematical weightings.
When pollsters discover their raw call logs contain far too few non-college-educated blue-collar workers, they do not hold field interviews in plant parking lots; they inflate the math behind the few respondents they did reach. If only three industrial mechanics answer the phone during a four-day survey cycle, the statistical software multiplies those three individuals until they represent the demographic footprint of three hundred local workers.
The central flaw hides inside that mechanical substitution: an off-shift worker who eagerly answers an unknown number at 6:30 PM is fundamentally different from a third-shift machinist whose phone sits locked in a steel locker across town. By treating compliance as an interchangeable trait, battleground polling models inadvertently select for an atypical, institutionalized subset of the working class, completely obscuring the simmering ballot shifts happening along the actual assembly lines.
- Gavin Newsom regulations trigger sudden refinery fee spikes across western states
- Federal border orders shift sudden security costs onto county sheriffs
- New Mexico border security proposals force fierce congressional showdowns over emergency troop funding
- Sherrod Brown confronts Senate debate rival over secret Rust Belt trade pact concessions
- Early primary states derail frontrunner campaign momentum through unscripted diner voter confrontations
The Stamping Plant Blindspot
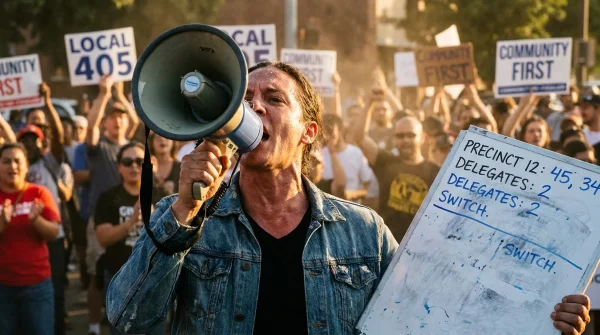
Mark Kowalski, a 52-year-old tool-and-die technician at a precision stamping plant outside Erie, has never participated in a political survey in his life. Between ten-hour shifts on his feet, mandatory safety briefings, and coaching middle school baseball, his call-screening app automatically dumps ten unidentified calls a day into the digital trash bin. When a prominent national poll claimed his county was tracking five points toward the status quo last autumn, Mark’s union hall had already spent two months debating a complete break from historical endorsements over localized trade rules, an internal fracture that never surfaced in a single headline survey until the physical ballot boxes cracked open on election night.
Three Lenses On The Sampling Mirage
To understand why these forecasts fracture under pressure, you must look at how modern labor patterns actively dismantle standard research filters.
The Rotating Shift Technician: Industrial schedules rotate through swing and graveyard hours, meaning their free hours fall during normal sleep cycles or deep family time. When telephone screeners dial between 4:00 PM and 8:30 PM, this entire demographic registers as dead air. The computer records a non-contact, discarding the exact wage-earner who feels regional inflation most acutely at the gas pump.
The Mobile Service Provider: Plumbers, line workers, and home health aides spend their waking hours navigating client sites, driving service vans, or caring for patients under strict sanitation protocols. Because their livelihoods depend on filtering personal calls from job dispatches, they screen with cold precision, ensuring political inquiry centers never pierce their daily routine. The resulting sample systematically substitutes desk-bound professionals who work from home for mobile tradespeople.
The Multilingual Trade Worker: In battleground growth corridors like Phoenix or Las Vegas, the construction backbone consists of bilingual or Spanish-first households who face an even steeper screening barrier. Polling scripts often default to English-first call centers or use stilted translation protocols that induce immediate hang-ups, blinding the model to rapid ideological shifts within diverse industrial unions until precinct clerks tally the paper slips.
Auditing The Margin Before Election Night
You do not have to remain captive to misleading survey headlines if you know how to read the baseline data with a skeptical eye. Evaluating political momentum requires ignoring the horse-race graphic and inspecting the underlying scaffolding.
Always verify the contact methodology buried in the survey’s methodology release. If a poll relies entirely on live telephone interviews without a registered voter matched panel (RBS), treat its working-class projections as suspect.
- Check the educational weighting split against the physical US Census profile for that specific battleground county, looking for gaps wider than three percentage points.
- Examine whether the sample surveyed shifts during active industrial operating windows or strictly during white-collar commuting blocks.
- Track local county-level party registration switches and early ballot ballot-curing rates rather than statewide topline preference percentages.
- Look for unweighted respondent tables in the appendix to see how many non-degreed union workers actually picked up the phone.
Your tactical toolkit should always include the direct public record from state secretaries of state. Compare the raw sample size of blue-collar precincts in the poll with the actual historical turnout volume from those same wards over the past two midterm cycles.
When The Map Finally Clears Its Throat
Recognizing the baseline flaws in modern voter modeling grants you a rare, grounding clarity during noisy electoral seasons. You no longer feel whip-sawed by every two-point fluctuation trumpeted by morning pundits, because you understand the quiet mechanics running beneath the apparatus.
Real communities do not announce their choices to telemarketers on Tuesday evenings; they work, they negotiate grocery bills around kitchen tables, and they cast their votes in silent determination when the time arrives. When you stop mistaking the map for the physical territory, you gain the quiet patience required to watch history unfold on its own terms.
The most decisive voter in the precinct is almost never the person who picks up the phone.
| Key Point | Detail | Added Value for the Reader |
|---|---|---|
| Phone Non-Response Bias | Survey response rates have dropped from over 35% in the 1990s to under 2% today. | Explains why headline percentages swing wildly without real voter sentiment changing. |
| Synthetic Weighting Distortion | Models multiply single blue-collar answers by huge factors to meet demographic quotas. | Reveals how an eccentric individual respondent can accidentally skew an entire state projection. |
| Industrial Schedule Blinds | Call windows match corporate white-collar hours, missing second- and third-shift workers. | Provides a clear framework for judging which public polls to trust and which to ignore. |
Frequently Asked Questions
Why do polling firms continue using phone interviews if response rates are this low? Live-caller telephone methods, while increasingly flawed, still offer an established historical baseline and lower upfront costs than sending trained field researchers into industrial communities for face-to-face panels.
How does education weighting distort blue-collar political trends? When pollsters reweight data to compensate for low non-college participation, they assume non-college respondents who take surveys think exactly like those who refuse them, masking deep ideological splits within the workforce.
Do online surveys solve the shift-worker screening issue? Online opt-in panels introduce their own distortions, often attracting highly politicized, hyper-online internet users rather than representative wage earners who rarely click on web-based survey panels.
What is the best alternative metric to gauge battleground races? Examining local voter registration changes, small-dollar donor ZIP code dispersion, and union local internal straw polls consistently provides a clearer signal than public media polls.
When do these polling blindspots finally reveal themselves? These hidden miscalculations stay dormant until late on election night, when rural and industrial precinct totals finally drop into the county tally, often triggering sudden, unexpected shifts on the map.