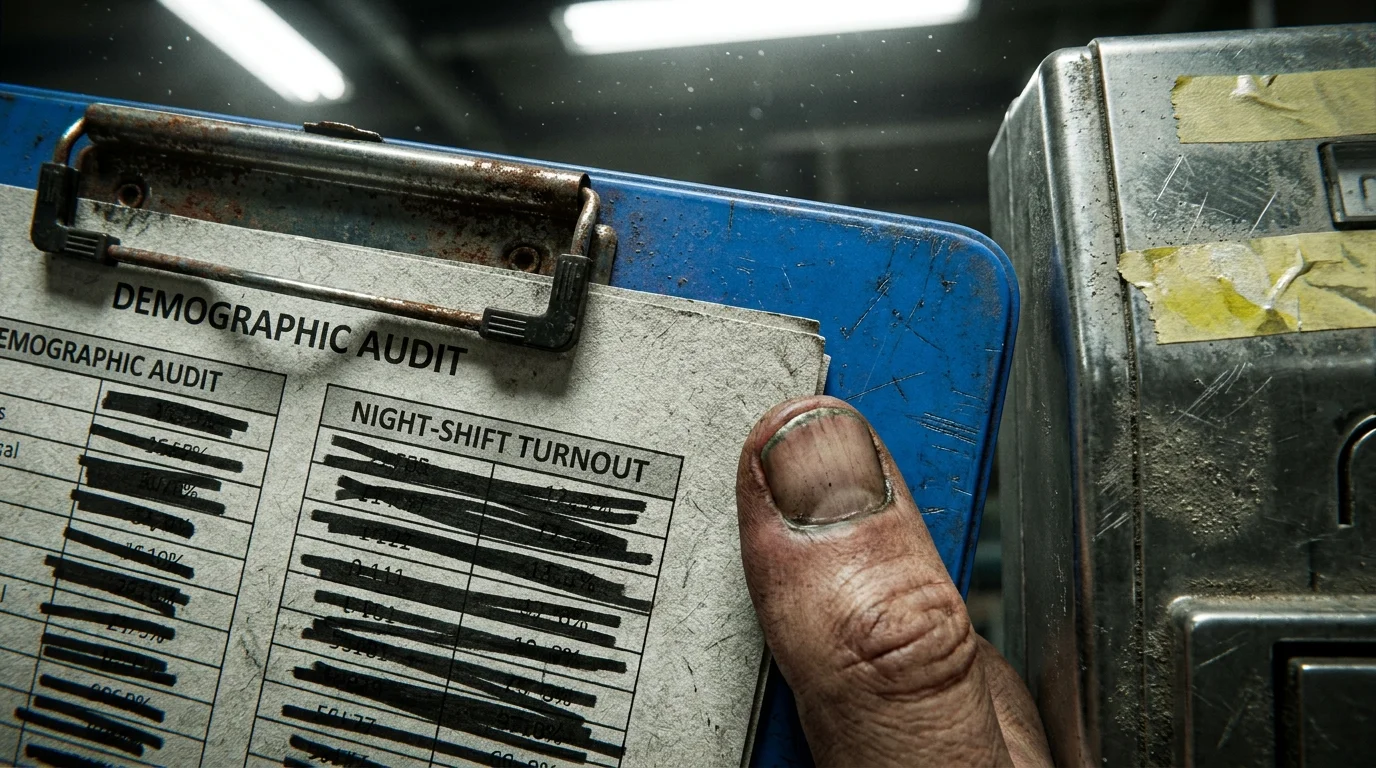
At 3:15 AM inside an automotive stamping facility in western Pennsylvania, the air carries the sharp tang of hydraulic fluid and scorched metal. Fluorescent tubes hum overhead, casting an unforgiving glare across rows of grimy plastic clipboards stacked near industrial punch clocks. You can hear the rhythmic, heavy thump of steel pressing into form, punctuated only by the occasional scrape of safety boots against sealed concrete. While the rest of the county sleeps, three hundred people are halfway through a twelve-hour turnaround.
By two in the afternoon, these workers are dead to the world. Their phones rest face down on bedside tables, silenced against notifications, family check-ins, and incoming calls from unfamiliar area codes. When a statistical survey operation in suburban Virginia spins up its autodialers at 5:45 PM, seeking a representative pulse of working-class households, it registers an unanswered tone. To the predictive model, that silence is indistinguishable from civic apathy.
You are repeatedly told that modern sampling methods account for every walk of life through sophisticated post-stratification. The models claim to measure who will stand in line on a Tuesday in November by slicing electorates into tidy demographic boxes of education, race, and age. Yet behind those polished percentages sits a basic blind spot: entire shifts never pick up.
The Phantom Precision of Daytime Screens
Consider statistical weighting like tuning an analog radio through a frosted windshield. The pollster twists the dial, catches static, and assumes the silence means no music is playing on that frequency. In truth, the transmitter is broadcasting on a different schedule altogether.
When computer-assisted telephone interviewing (CATI) software logs an unanswered call, it cycles to the next record. Pollsters must deliver completed interviews on strict deadlines, so they rely on predictive screens to decide who counts as a likely voter. Because third-shift workers cannot answer their phones while sleeping or working locked-down assembly lines, their non-response gets baked into the data as low political engagement. Rather than adjusting the clock, the software simply suppresses the baseline turnout expectation for that entire zip code.
The system treats non-availability as indifference. Yet when election morning arrives, those same factory parking lots empty out directly toward precinct gymnasiums before the morning school rush even begins.
The Anatomy of Elena Vance’s Silence
Take Elena Vance, a 42-year-old quality control inspector at an engine plant outside Kenosha, Wisconsin. She clocks in at 6:30 PM and punches out at 7:00 AM, four days on, three days off. Her life operates on an inverted ledger: her main meal happens when the sun rises, and her deep sleep occurs between noon and 4:00 PM.
- FDA food dye certification rules trap snack makers under costly laboratory spectrum tests
- New Mexico mineral leasing bills block disputed energy drilling across arid tribal basins
- Caroline Sunshine debate panels trigger fierce television clashes over executive media credentials
- Federal procurement executive orders strip defense contractors of automatic cost overrun guarantees
- New Hampshire primary checklists demand brutal retail handshakes across freezing diner booths
Last autumn, Elena’s phone logged nineteen unrecognized calls over three weeks, all arriving between 4:30 PM and 8:15 PM. To the algorithms behind the major swing-state surveys, Elena was an unreachable ghost. The survey models adjusted their ratios upward for daytime suburban respondents to fill her geographic quota, under the assumption that someone matching her age and education profile was speaking on her behalf. But the daytime respondent had completely different household pressures, child-care costs, and daily concerns than someone walking concrete floors beneath industrial fans all night.
Where the Demographic Ratios Fracture
The gap between who pollsters reach and who actually casts a ballot expands significantly across specific labor bands. Each sector interacts with the statistical apparatus differently, creating distinct distortions in the underlying voter models.
Third-Shift Heavy Manufacturing
Workers here endure severe communication blackouts on the plant floor. Personal mobile devices are frequently locked in steel break-room lockers for insurance and safety compliance throughout the shift. Consequently, these voters log zero response rates during standard survey hours, meaning their actual ballot-box momentum is consistently underestimated until late precinct tallies trickle in.
Regional Logistics and Cold Storage
Warehouse selectors and forklift operators face rotating swing schedules that change every six weeks. Traditional polling models classify them as transient or low-propensity simply because their residential stability does not align with traditional suburban landline patterns. Yet their participation in local bond measures and municipal races remains remarkably steady.
Overnight Acute Care and Sanitization
This demographic leans heavily hourly, balancing fragmented shifts across multiple healthcare facilities. Their waking hours are consumed by irregular commutes and caregiving duties. Polling software interprets their missed calls as a lack of interest, failing to capture how utility costs and grocery inflation directly shape their choices at the ballot box.
Auditing the Model on Your Own Terms
You do not need an advanced degree in quantitative methodology to spot when a battleground survey has lost touch with the ground floor. You can evaluate the credibility of top-line findings by looking at the mechanical foundations of the poll itself.
Rather than accepting the final percentage margin at face value, scan the fine print of the methodology statement for clear signs of sampling bias:
- Check the Contact Window: Credible field efforts collect responses across multiple dayparts over at least five calendar days. If calling occurred exclusively between 5:00 PM and 9:00 PM across a 48-hour weekend window, shift workers were entirely locked out.
- Examine the Raw-to-Weighted Spread: Look at the adjustment ratio. If the pollsters had to apply an extreme weighting factor (greater than 1.8) to low-education, working-age voters to hit census targets, their sample is compensating for a tiny, unrepresentative pool.
- Scrutinize Likely Voter Thresholds: Investigate whether the model eliminates respondents based on past primary voting history. Hourly workers frequently skip primaries due to mandatory overtime, yet consistently turn out for general elections.
- Verify Mixed-Mode Outreach: Reliable operations combine text-to-web prompts with live calling. Text prompts can be opened at 3:00 AM during a scheduled lunch break, whereas unexpected telephone interviews demand immediate, live attention that industrial environments forbid.
A statistical sample is only as grounded as its reach. When you strip away the decimal points, a poll that talks only to people free to answer calls at dinner time is simply describing a comfortable daylight world.
Seeing the Hidden Shifts
When you learn to look past headline percentages and understand who is missing from the data, politics stops feeling like an unpredictable spectator sport. You begin to notice the invisible hands that keep county infrastructure moving: the water treatment operators, the line mechanics, the distribution crews fueling the late-night highway arteries.
Understanding this mechanical disconnect gives you genuine clarity. You no longer swing between anxiety and false confidence with every news cycle because you know the map was drawn without looking at the night shift. There is quiet reassurance in recognizing that our shared future is decided not by computer models dialing empty rooms, but by everyday people standing together in line in the crisp November chill.
Real representation begins when you stop expecting the working world to operate on banker’s hours.
| Key Point | Detail | Added Value for the Reader |
|---|---|---|
| Sampling Timeframe | Concentrated between 4:30 PM and 9:00 PM on weekdays. | Reveals why daytime-heavy polling systematically misses overnight hourly employees. |
| Likely Voter Screens | Filters that discard citizens without past mid-day turnout records. | Helps you spot when predictive models confuse shift-work hurdles with apathy. |
| Weighting Multipliers | Statistical inflation applied to small pools of available respondents. | Explains why a survey can appear demographically balanced while missing the real sentiment. |
Frequently Asked Questions
Why don't survey companies simply call shift workers during the daytime?
Federal regulations and polling guidelines strictly limit early morning outreach, and callers cannot reliably guess an individual's specific sleep schedule. As a result, companies stick to late afternoon hours where daytime response yields are highest.Does this mean all public opinion polls are fundamentally inaccurate?
Not entirely, but it explains why races in heavily industrialized swing states frequently show unexpected election-night shifts that diverge sharply from pre-election forecasting.Can text-based polling fix this sampling distortion?
Text-to-web messaging helps because it allows hourly workers to respond on their own schedule, though low response rates and carrier spam filters still introduce significant noise.How do pollsters know they have a shift-worker shortage?
Audits comparing raw post-stratification data against actual county-level employment records quickly reveal deep gaps in hourly manufacturing and transport representation.What is the quickest way for me to spot a flawed state poll?
Scroll straight down to the field dates and interview methodology. If the entire study was completed in two days using only landlines or evening calls, treat its conclusions with healthy skepticism.