The dashboard clock glows amber against the pre-dawn mist at 5:15 AM outside a distribution hub in Lordstown, Ohio. You can hear the steady, hydraulic thrum of diesel engines idling in staging bays, paired with the tinny click of turnstiles swallowing employee badges. Travel mugs sit balanced on truck consoles, lukewarm coffee washing down the remnants of a split-shift fog before the morning whistle cuts through the yard.
By 2:00 PM, while you are buried beneath pallet racks or steering an overhead crane through sheet metal, comfortable survey phone banks two time zones away initiate their dialing blocks. A phone vibrates silently inside a metal locker down an echoing corridor. Three rings, a voicemail click, and an algorithm flags your profile as a non-contact, discarding your political pulse before you ever scrub the grease from your knuckles.
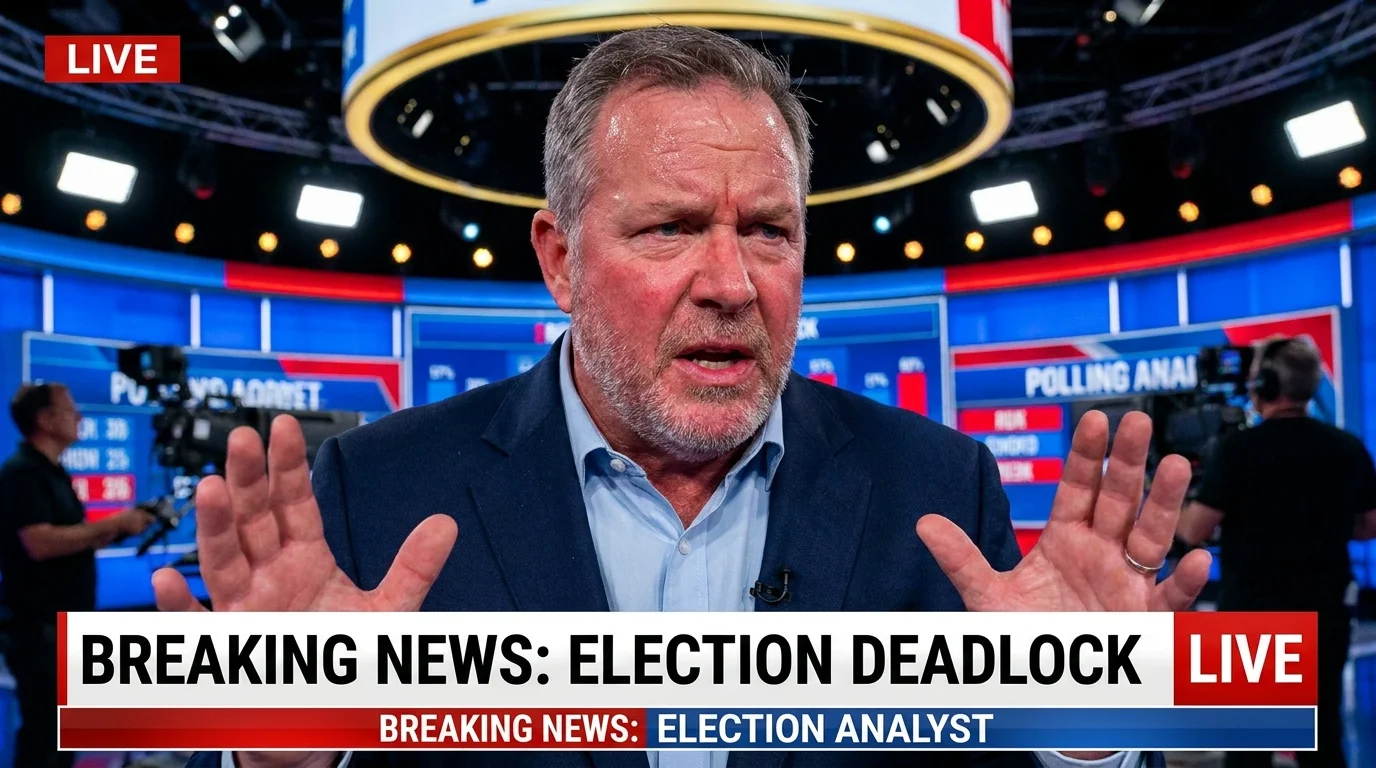
Standard broadcast coverage treats polling numbers like stone-carved gospel, mapping district leads with calm graphics that mimic mathematical certainty. Yet every cycle, the sudden shockwave of final precinct tallies leaves cable anchors staring at map boards in frantic disbelief. The numbers did not fail because working people changed their minds; the metrics broke by design long before the sun set on Tuesday.
The Phantom Sample and the Clock-Punch Filter
To understand the breakdown, you have to look past the top-line percentages and examine the machinery that produces them. Polling shops run on tight production timelines, utilizing automated response filters known across the industry as likely voter screens. These screens do not merely measure whether you care about the race; they score your likelihood of casting a ballot using rigid behavioral proxies built for desk-bound lifestyles.
Think of it like inspecting a bridge using only drone cameras that fly during clear blue skies, completely ignoring the structural stress occurring under zero-visibility midnight storms. The screens rely heavily on daytime landline pickups, rapid mobile callbacks, and answers to historical participation questions that penalize anyone whose voting history was interrupted by mandatory plant overtime or unpredictable childcare scrambles. When an algorithmic filter assumes reliability looks like a nine-to-five routine, entire production floors disappear from the statistical model.
This baseline sampling distortion creates an artificial, paper-thin consensus. If an answering quotas matrix needs four hundred responses in a congressional district by late afternoon, field houses burn through the easiest contacts available: remote workers, retirees, and salaried professionals who can take an unexpected call while checking spreadsheets. Your voice gets replaced by the easiest available substitute, baking an upper-middle-class policy bias directly into the margins.
- Laurence Tribe warnings ignite fierce congressional floor clashes over emergency presidential powers
- Battleground Senate debates erupt over disputed entitlement cuts as live polls register panic
- New Hampshire primaries crush frontrunner war chests through direct living room voter scrutiny
- Senate agriculture drafts secretly trade rural nutrition subsidies for Southern crop baselines
- Kroger grocery aisles face sudden consumer boycotts over automated digital price tags
Behind the Clipboard: Dan Kowalski’s Silent Shift
Dan Kowalski, a 44-year-old third-shift CNC lathe operator outside Kenosha, Wisconsin, keeps a drawer full of unreturned voter surveys alongside his spare earplugs and micrometer cases. Last October, public trackers showed his legislative district leaning comfortably toward an incumbent candidate by six points, based on four consecutive public surveys conducted between midday Monday and Thursday afternoon. Dan never answered a single call; his ringer stays muted until 3:30 PM so he can sleep through morning delivery traffic after ten hours on a concrete floor. When pollsters asked Dan’s demographic peer group if they had voted in the last two off-year municipal elections, the survey screen dropped respondents who answered ‘no’—ignoring that Dan works sixty-hour weeks during local cycles but never misses a federal contest. When the actual paper ballots ran through the optical scanners on election night, Dan and twenty-two hundred swing-shift machinists crossed the county line totals, flipping the seat by four hundred votes and leaving campaign strategists scouring precinct maps for phantom turnout anomalies that were hiding in plain sight all autumn.
Layers of Erasure: Who Falls Through the Algorithmic Sieve
The gap between survey modeling and physical ballots widens across three distinct industrial rhythms, each reacting against conventional polling filters in predictable ways.
The Rotating Roster
Workers on swing schedules—three days on, four nights off, followed by twelve-hour rotations—live outside traditional calendar rhythms. Polling organizations operate on compressed field windows, often wrapping an entire district survey in seventy-two hours. If that window hits during an active swing stretch, the worker is mathematically dead to the data set. Because the algorithm treats five consecutive unanswered rings as a hard refusal, these voters are categorized as disengaged rather than unreachable.
The Multi-App Gig Commuter
Courier drivers and logistics contractors working staggered morning and evening surges cannot risk taking unknown phone numbers while tracking route navigation. The cost of answering a ten-minute demographic screen is an actual loss of paid delivery slots. Standard sampling frameworks misunderstand this practical boundary, assuming that silence signals civic apathy rather than economic survival.
The Trade Apprentice and New Hire
Younger blue-collar voters frequently register at addresses tied to their parents or union locals while completing regional training stints. Traditional screens weight heavily toward stable, long-term residential parcel records. When contact attempts fail to hit verified desktop landlines or address-matched mobile registers, automated weight models re-balance the entire age bracket by over-sampling urban college students, distorting the actual blue-collar youth vote.
Mindful Verification: Auditing the Numbers Yourself
You do not have to accept the evening news narrative at face value. You can read political research with the sharp, diagnostic eye of a mechanic evaluating an engine tick. Whenever a fresh wave of state polling hits your feed, run the underlying methodology through a tactical checklist before letting the results adjust your blood pressure.
- Locate the field window dates and daily calling hours buried inside the survey’s published cross-tabs.
- Check the weighting methodology to see if education and trade status are balanced separately, rather than grouped under a single generic income bracket.
- Look for the raw screen drop rate: the specific percentage of respondents who picked up the phone but were rejected before answering candidate preference questions.
- Examine the ratio of landline to cell phone dialing, noting whether texts or automated self-response options were used to accommodate non-standard shifts.
Treat political polling like a weather forecast generated by an airport sensor forty miles north of your farm. Physical reality always takes precedence over sterile predictive modeling.
| Verification Check | Diagnostic Threshold | Field Implication |
|---|---|---|
| Calling Window | Less than 5 business days | Filters out rotating shift workers on active plant stretches. |
| Screen Severity | Above 35% respondent drop rate | Over-indexes salaried workers with flexible weekday schedules. |
| Mobile-to-Landline Ratio | Below 65% mobile completion | Manufactures artificial polling leads for suburban establishment bases. |
The Precision of the Count
There is quiet dignity in the physical act of marking a paper ballot with a black felt-tip pen, feeding it past the rubber rollers into a steel drop box, and feeling the tally counter tick upward by one. For all the algorithmic weight adjustments, the proprietary screen parameters, and the breathless afternoon talking points, a vote cast at 6:45 PM by someone whose hands still smell of industrial coolant carries the exact same mathematical weight as a vote cast by a corporate lobbyist at noon.
When you recognize that likely voter screens are corporate marketing tools running on cheap administrative shortcuts, the illusion of pre-determined political outcomes dissolves. The system misreads blue-collar labor because it operates on leisure-class convenience. True leverage does not live in an afternoon sample curve; it lives on the plant floor, on the delivery route, and inside the quiet tally sheets that only speak when the shift is finished.
The machine measures only who picked up the line, never who showed up to move the freight.
Frequently Asked Questions
Why do polling organizations keep using screens that miss shift workers?
Polling companies face severe budget cutbacks and operate on tight commercial news deadlines, making automated daytime call quotas far cheaper to complete than labor-intensive, multi-day reaching protocols.Does this screen bias favor one specific party over another?
Not consistently. The bias tends to favor whichever candidate appeals to higher-income, college-educated suburban demographics, while under-counting populist, trade, and hourly labor movements across both major parties.What is the difference between a registered voter poll and a likely voter poll?
A registered voter poll counts anyone officially on the rolls, while a likely voter poll applies arbitrary behavioral and schedule-based filters to guess who will actually show up.How can I tell if a poll accounted for blue-collar labor?
Check the methodology statement for ‘education-by-race weighting’ and extended evening or weekend dialing windows, which provide space for hourly workers to answer.Why do swing states experience the biggest election night polling shocks?
Manufacturing-heavy swing states have high concentrations of third-shift, logistics, and hourly plant operations, magnifying the baseline distortion when automated calls fail to reach them.