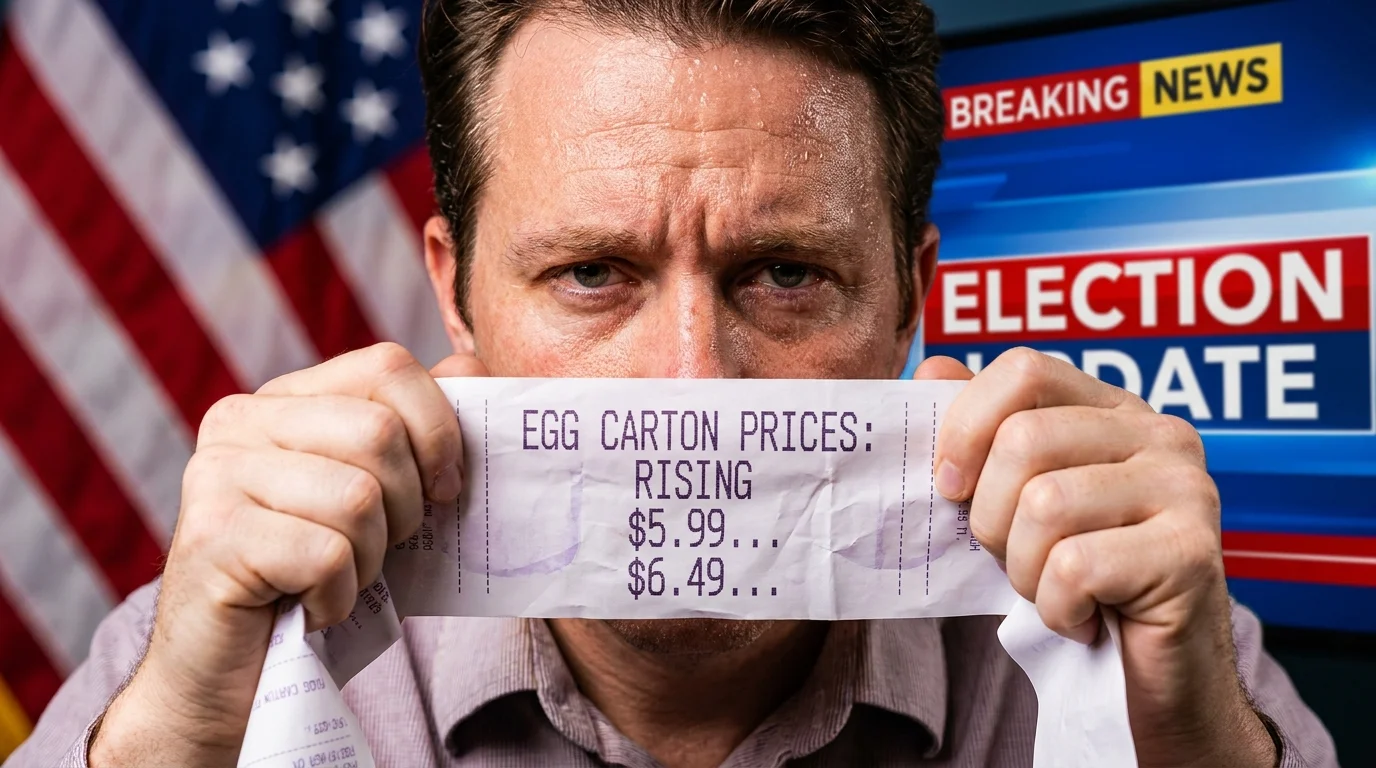
Under the buzz of humming supermarket fluorescents, the paper that spatters out of the register tells a story no mathematical modeling team in the capital ever reads. You smooth out that coiled ribbon of pale thermal paper against the plastic cart handle, staring at the faint ink lines where a carton of generic white large eggs now punches an aggressive six-dollar hole in your weekly margin. There is a sharp scent of damp cardboard and floor wax in the checkout lane, a rhythmic clacking of scanner belts moving forward, while behind you three people shift their weight on tired heels, calculating their remaining cash before the register totals their bread, milk, and canned vegetables.
In the air-conditioned office towers where national campaign strategies take shape, screens glow with an entirely different universe. Staffers and policy analysts pass around color-coded charts celebrating upward ticks in consumer confidence and retail health, confident that the country feels resilient. To them, the macroeconomic climate looks stable, predictable, and remarkably steady. They see numbers floating upward while completely missing the quiet friction happening at every physical point of sale across the country.
This disconnect is not an accident of poor communication; it is an engineered blind spot built into modern demographic measurement. When standard monthly indices sample the public, they depend on an increasingly narrow slice of citizens who actually pick up unidentified calls on a Tuesday afternoon. What gets recorded as the collective economic mood of the nation is actually the self-reported comfort of households that can afford to answer an unknown number while working from a quiet kitchen island.
The Echo in the Telephone Wire: Sampling from Behind Double-Glazed Glass
Imagine trying to gauge the temperature of an engine by touching the tinted glass of the passenger window. That is precisely how modern campaign forecasts interact with the actual economy. The mathematical baseline relies on computer-assisted telephone interviewing where response rates have dropped into the low single digits over the past twenty years. When a statistical survey rings a mobile phone at 2:15 in the afternoon, who actually hits the green button and stays on the line for twenty minutes? It is almost never an hourly worker on a warehouse floor or an electrician running conduit inside a dusty crawl space.
Instead, the sample skews heavily toward salaried professionals who navigate meetings over home broadband, sip pour-over coffee, and order their groceries via mobile apps that disguise delivery surcharges inside convenient line items. The survey universe leans affluent, heavily urban, and structurally insulated from the relentless day-to-day pinch of cash-register math. Because this demographic still feels discretionary flexibility, their answers register as cheerful optimism in national indices. When campaigns plug those rosy numbers into their electoral roadmaps, they convince themselves that kitchen-table anger is merely an online rumor rather than an approaching electoral hurricane.
- EPA refrigerant transition rules force costly air conditioner replacements across aging suburban homes
- Naval Support Activity Bahrain upgrades demand emergency Senate showdowns over Persian Gulf deployments
- Ted Cruz debate clashes trigger instant voter backlash after disputed live spending exchanges
- South Carolina primary exit tallies expose brutal retail campaign realities across rural diner counters
- Defense Production Act mandates spark quiet factory retooling orders bypassing gridlocked congressional votes
Consider Elena Ramirez, a 43-year-old dispatch supervisor at a regional logistics hub in eastern Pennsylvania. Elena works forty-six hours a week managing delivery routes while tracking every dollar that leaves her checking account to feed two teenagers. “Last month, my phone lit up three times with unknown polling numbers while I was coordinating ten late freight arrivals in the middle of a shift,” she told me over coffee at a roadside diner. “I swiped decline every single time. The people running those surveys don’t talk to anyone who punches a physical time clock; they talk to people who have the luxury of taking a twenty-minute break to discuss their feelings about the bond market. Then politicians act astonished when working parents vote like they are walking through fire.”
The Two Economic Realities Splitting the Map
The gap between what national indexes report and what precinct voters experience comes down to structural class insulation. To evaluate real economic pressure, you must examine how different income groups absorb basic living costs.
The Telework Salary Cushion
For the salaried demographic overrepresented in monthly telephone polls, inflation is largely an irritation rather than a crisis. Their mortgage rates are often locked at historic lows from several years ago, their commuter gas expenses shrank thanks to hybrid work schedules, and their primary concerns involve the performance of their mutual funds. When pollsters ask whether now is a good time to make major household purchases, these respondents answer through the lens of asset stability and disposable cushion.
The Hourly Retail Baseline
For hourly workers and service-sector households, there is no remote work buffer or stock portfolio shield. Every dollar spent on fuel, eggs, cooking oil, and ground beef comes directly out of cash flow that is already stretched to its absolute perimeter. Receipts dictate everyday reality far more powerfully than any press conference or federal reserve summary. When these families walk into voting booths, they do not cast ballots based on abstract consumer sentiment curves; they vote on the persistent, exhausting exhaustion of paying thirty percent more for their staple protein sources than they did three years prior.
Auditing the Ledger: How to Read the Real Economy
Cutting through institutional spin requires looking past headline indices and watching where physical cash collides with weekly household necessity. If you want to understand where the political landscape is actually tilting before the first exit poll drops, tune your focus to practical ground signals.
- Audit your local paper receipts: Track staple groceries over ninety-day windows rather than trusting national core inflation numbers that deliberately strip out volatile food and energy costs.
- Observe payment splits at point-of-sale: Watch how many people in neighborhood grocery queues are splitting transactions across multiple debit cards or relying on short-term installment financing apps for simple basket runs.
- Track regional discount grocery foot traffic: Spikes in foot traffic at salvage grocers and surplus retail chains serve as a direct, unvarnished indicator of community financial stress long before it registers on an academic survey.
- Watch municipal utility collection rates: Local water and power shutoff notices offer an immediate, unfiltered look at working-class liquidity that telephone pollsters will never capture.
By shifting your attention toward these tangible metrics, you begin to see the true momentum that decides precinct tallies. Field observation beats telephone sampling every single time, giving you an honest appraisal of the pressures shaping the national mood.
The Ground Floor Perspective
When election night arrives and political commentators express shock at wide shifts in historically steady working-class districts, remember that the voters did not suddenly change their minds in the voting booth. They had been signaling their reality every single week on the back of crumpled thermal paper register receipts that institutional models chose to ignore.
Reclaiming clarity means trusting what you see at your kitchen counter when the envelopes get opened and the grocery bags get unpacked. True political insight does not live in polished indices or computer dashboards; it lives in the tangible, unmistakable weight of everyday life experienced by people who work for an honest wage.
“When an economic metric no longer reflects the cost of feeding a family on a Tuesday night, it ceases to be a measurement and becomes an illusion.”
| Key Point | Detail | Added Value for the Reader |
|---|---|---|
| Sampling Distortion | Telephone surveys over-index on work-from-home households with time to answer unsolicited calls. | Explains why headline optimism constantly contradicts everyday personal experience. |
| Thermal Receipt Metric | Staple grocery prices like eggs and milk directly influence working-class voting choices. | Provides a grounded, personal benchmark to assess true community economic pressure. |
| Turnout Blind Spot | Hourly workers ignore pollsters but turn out in force on precinct voting day. | Prepares you to anticipate sudden electoral shifts that national forecasts miss entirely. |
Frequently Asked Questions
Why do Consumer Sentiment surveys fail to reach hourly wage earners?
Hourly workers face rigid workplace rules prohibiting personal phone use during shift hours. As a result, telephone response rates among these workers have collapsed, leaving survey samples heavily weighted toward remote, salaried professionals with flexible afternoon time.What makes grocery costs more politically influential than other price indicators?
Unlike rent or car payments made once a month, grocery purchases happen weekly. Seeing rapid price adjustments on staple foods like eggs, flour, and dairy creates repeated psychological reminders of household financial vulnerability.Why do national forecasts exclude food and energy to measure trendlines?
Statisticians strip out food and energy to create a less volatile baseline called core inflation. While mathematically useful for setting long-term interest rates, this omission ignores the very expenses that dominate working-class family budgets.How does this survey distortion influence campaign messaging?
Campaigns rely on headline sentiment indices to craft their stump speeches. When indices show optimism, candidates spend precious airtime celebrating abstract economic health, which alienates voters who are actively struggling with everyday bills.What is the most reliable way to monitor local economic sentiment?
Rather than following national telephone surveys, look at hyper-local markers such as utility arrears in your municipality, generic brand market share in neighborhood supermarkets, and school supply drive participation rates.